With Weldware® or JMatPro, the microstructure formation by welding can be determined from the temperature profile or the cooling rate.
A defined cooling rate is required to produce a specific microstructure with specified mechanical properties.
The cooling rate can be controlled by the energy of the weld path and the preheating temperature. These two parameters are designed with the heat control. The numerical tool for temperature field calculation is the weld structure simulation.
Welding changes the material state in the heat-affected zone and in the weld.Structural transformations occur in transforming steels. These depend on the material and the temperature cycle. The temperature cycle, the time-temperature curve at an evaluation point, is calculated for more complex components from the weld structure simulation. The sheet thickness ratios or mass ratios of the adjacent components are included in the temperature field calculation, as is the material-specific thermal conductivity.
In the case of transforming steels, the transformation is described for each steel grade or the chemical analysis of the batch used by means of the weld ZTU diagram. Welding ZTU diagrams can be obtained from the WeldWare® welding technology consulting tool. WeldWare® is based on a large number of welding CSTU diagrams determined by tests. The data are linked via regression equations so that they can be evaluated for any batch of the respective steel grade. Based on the cooling rate, the T8.5/5 time, WeldWare® provides the information on microstructure composition, mechanical strengths, elongation at fracture and hardness.
The T8.5/5 time is derived from the temperature cycle calculated with the manufacturing simulation. In order for a microstructure with the desired mechanical properties to be set, a certain T8.5/5 time must not be undershot. To ensure this, a certain line energy or preheating temperature must be maintained. The design of these parameters to maintain the cooling time is called heat conduction. The thicker the components are, the more critical the heat dissipation becomes and the more important is the design of the heat conduction.
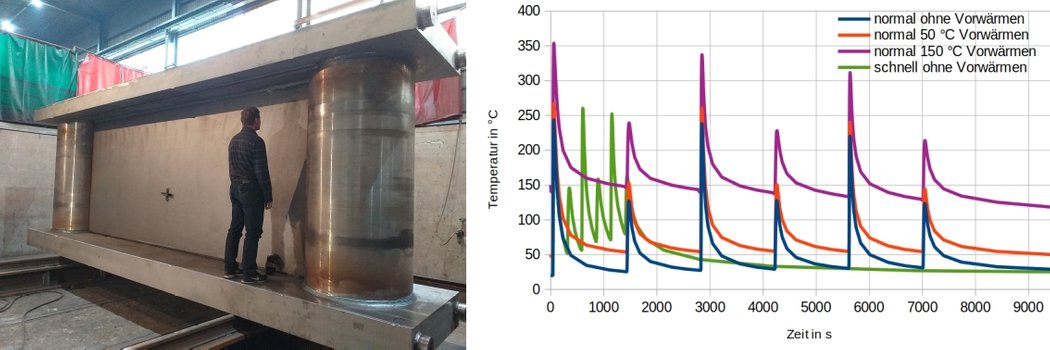
Based on simulation, it can also be evaluated whether the preheat temperature is maintained over the seam tracking speed, increases or decreases with increasing layer buildup. The following figure shows the temperature curve for the neck fillet weld in the area adjacent to the seam, using a very thick-walled press beam as an example. The temperature cycles are shown for three preheating temperatures and for a slow bead sequence. The temperature decreases steadily from bead to bead for a slow bead sequence. At a certain caterpillar sequence frequency, the condition occurs where the temperature increases steadily.
A desired temperature profile, the interpass temperature and whether this remains constant over the filling process can be predicted and set via the simulation.

© Dr. Loose GmbH, alle Rechte vorbehalten | Impressum | Datenschutz | Rechtliche Hinweise